Origin-Destination Analysis tool allows analysing the trip patterns in multiple ways. That creates the opportunity for diversity in results which may vary based on the customer needs.
Because you are free to draw your regions in whatever way you wish, it is possible to create different scenarios.
Use Case 1
Let’s say an advertisement company wants to see which bridge was used the most while crossing the river in Berlin to know where to place their billboards while advertising some social events to increase their marketing reach. Or maybe the city council wants to modernize bridges but wants to analyse the network to pick the least used bridges first to prevent heavy traffic interference.
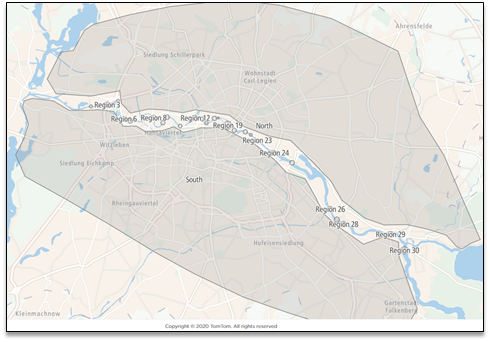
It is very simple to receive such results in Origin-Destination Analysis. Below you can see that it is possible to create one big region around the north side of the city, one big region around the south side of the city and multiple small regions on each bridge between them.
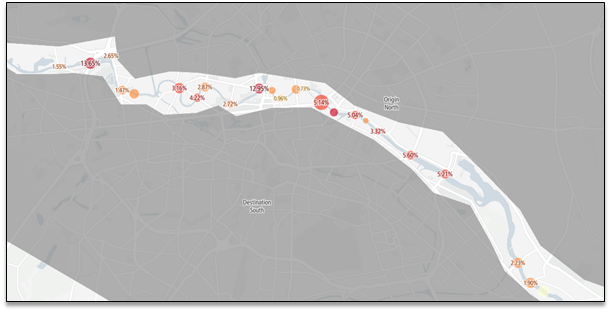
Once you have such an analysis calculated, you can go straight to the results. In the “Map Flows” section, you can mark the upper regions as the Origin and the bottom regions as the Destination.
Just by following these two simple steps, you will be able to see the whole trip distribution between these zones.
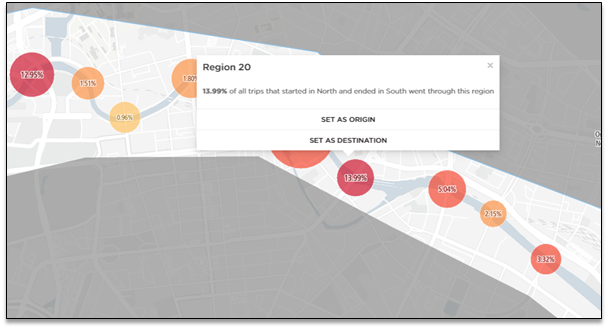
Now you can zoom in to the bridge you are interested in, for example – the one marked as Region 20. You can see that it is the most travelled bridge among all the nearby bridges, with 13.99% of all the trips from the north side of the city to the south side of the city going through it.
Use Case 2
Instead of drawing the regions on your own, the O/D Analysis tool allows you to select already predefined administrative areas by clicking them on the map in the region creation section.
That way it is incredibly easy to analyze the trip patterns between different admin areas of a specific location.
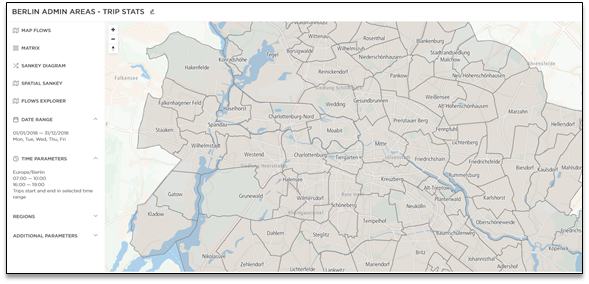
Once you have your administrative areas selected and the analysis calculated, you can go straight to the results and customize the region relations you are interested in.
Useful way of reviewing the relations between multiple regions is to use the Flows Explorer section. It allows you to mark any region as Origin, Destination, Via, or both Origin or Destination so you can customize the flows in any way possible.
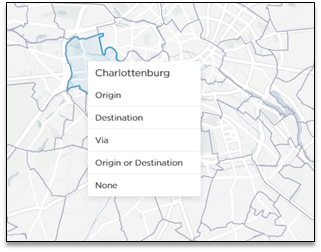
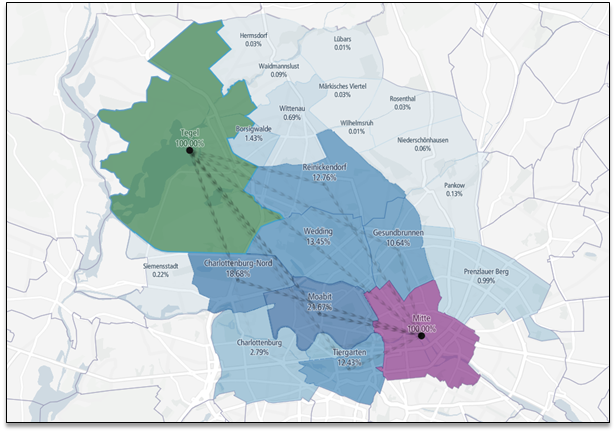
As an example scenario - the city council wants to reduce vehicle congestion and pollution by opening new public bus transport routes from Tegel administrative area to Mitte, the city center.
To plan the routes, they need to know which admin areas are the most traversed ones on the route from A to B. It is simple to see that outcome in O/D Analysis. All you need to do is to mark the Tegel region as either the Origin or Destination, then mark the Mitte region as either the Origin or Destination and finally mark all the regions between them as Via.
The results would help to see the trip patterns between these zones: