This type of analysis is capable of calculating the trip distribution (both inbound and outbound) of all the trips on the consecutive road segments within 5 to 50 kilometers from the link selected by the user.

Date & Time Ranges
The first two steps of creating such a report are the same as in the case of a regular Origin/Destination analysis. These steps consist of selecting date ranges and time ranges that are going to be analyzed. You can learn more about it here:
https://support.move.tomtom.com/od-analysis-creation-date-and-time-ranges/
Selecting A Link
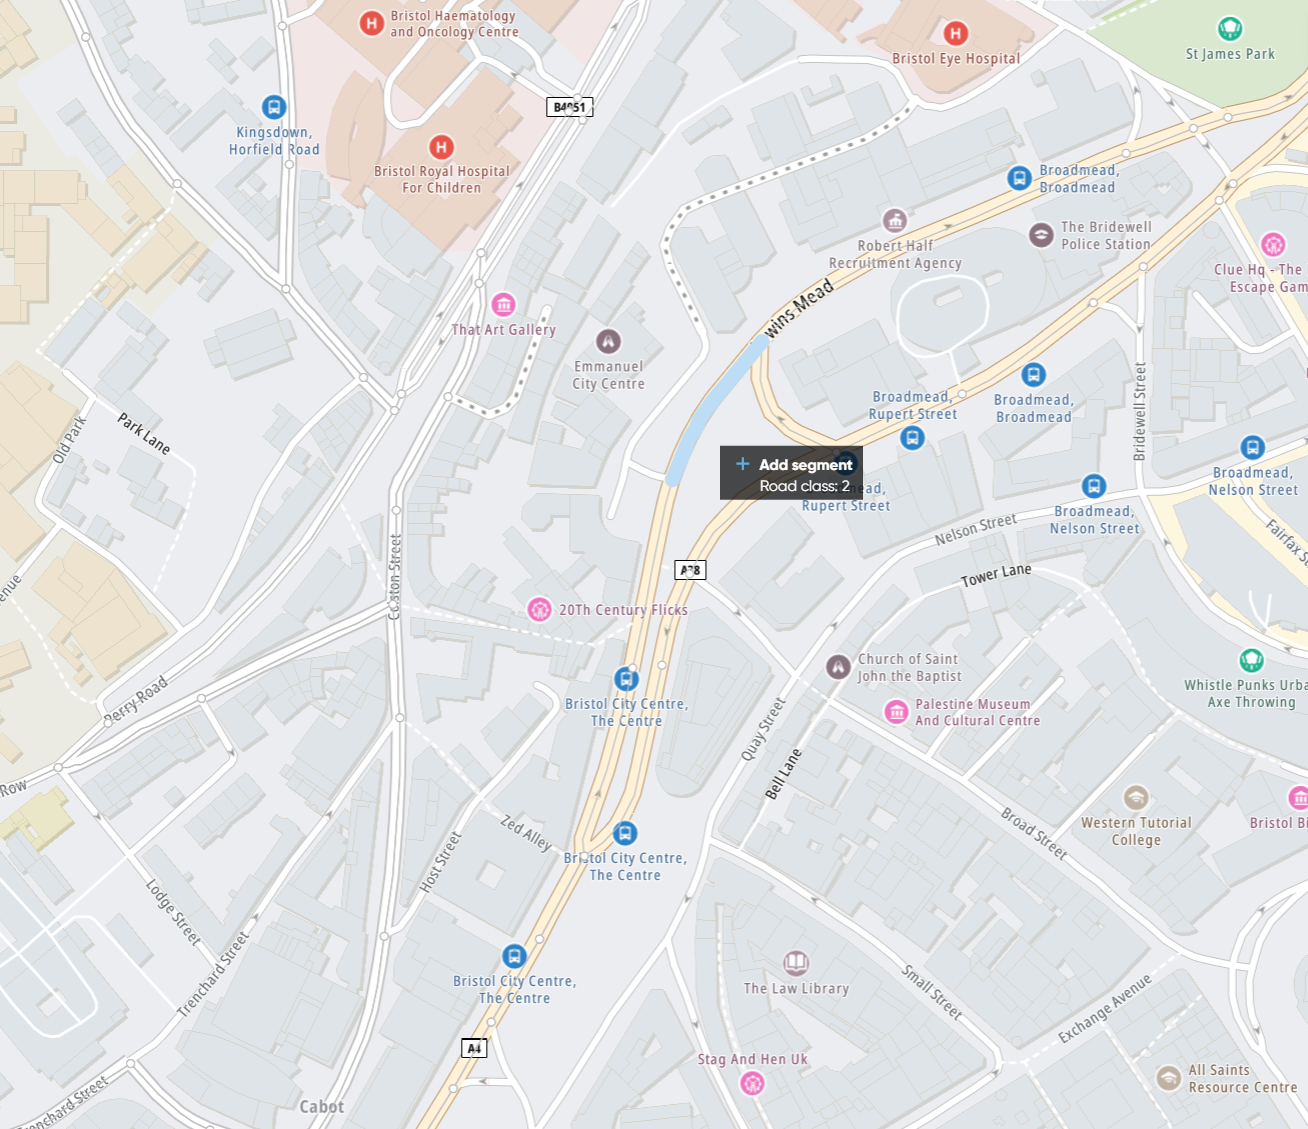
The third step is a map view where it is possible to select the road segment (which we also call "link") that is used to calculate all the inbound and outbound trips.
To select the link, it is necessary to go to a specific location and zoom in to see the road network segments:
Before choosing a road segment to analyze, it is possible to adjust the map version of the visible segments network. By default, the tool is always selecting the version related to the analyzed date range used in the analysis, but it is always possible to change it if needed.
Changing the map version might be useful when comparing different analyses results in case there were some map geometry changes caused by local roadworks.

Once the road segment is selected, it will be highlighted and arrows should appear on the adjacent roads. The arrows are showing the direction of the trips and roads that are going to be analyzed.

In the case when the analyzed road is bi-directional and the user wants to analyze the opposite direction, it is possible to use the "Reverse" button to change it. If the road is one-directional, the button will be grayed out.


To help with more complicated use cases or when the user wants to analyze the trip distribution for a specific route, it is possible to select more road segments by just clicking them on the map.
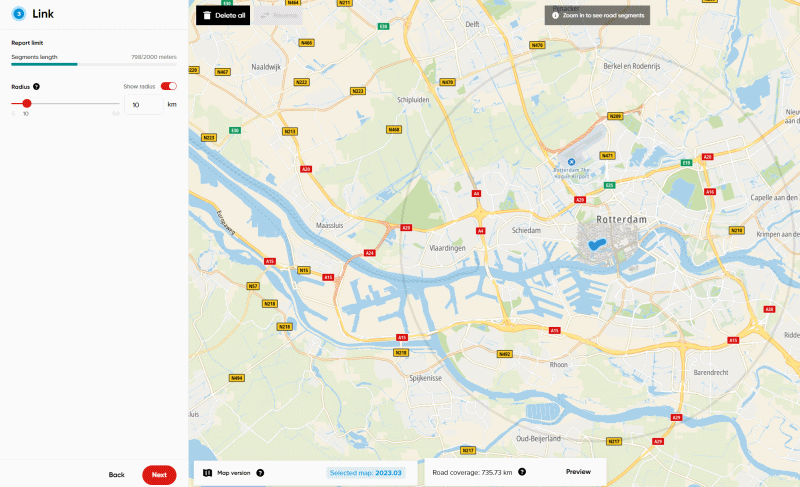
The limit of all the selected road segments length in a single report is 2000 meters.
Important Note! If the link is longer than a single segment (multiple segments are selected consecutively), it's very important to remember that vehicles need to traverse the whole route to be included in the results.

Keep in mind that it is only possible to select the segments that are located consecutively to the end of the selected route. The available ones are distinguishable by a line of arrows located on them. It is not possible to select routes that are going in multiple directions at the same time.

When defining a link, you are also able to adjust the radius of trips that will be analyzed in the report. The radius ranges from 5 kilometers to 50 kilometers.


Changing the radius value will set the analysis specifications to calculate only the trips within the boundaries of that area. To better understand the size of our radius, please enable the "Show radius" option, which will visualize it on the map.
Analyzing A Region
Instead of analyzing the incoming and outgoing trip patterns related to a segment of a road, it is also possible to analyze them based on a region of our choosing.

Defining this type of geometry is similar to defining a link, but instead of selecting segments on the road network, users have to click on the map to define points that will ultimately form a closed polygon.
The size of this polygon is limited to 3 km². The O/D Analysis product is currently optimized to handle this limit without affecting the performance of report calculations. Calculating all the trip paths entering or leaving our zone is more challenging and resource-demanding than calculating a regular Selected Link report. We will consider increasing this value in the future.
Note! The 3 km² value is related solely to the size of our polygon. The radius for calculating the actual trip paths is based on a 10 km area.
Once the analysis polygon is defined, it's also possible to choose which road classes to include in the results. Please note that this selection applies only to the entry and exit points of the polygon, not to calculating roads further away from our area on the road network.

Pricing Coverage
There is another important value that is shown next to the map version (on the right of it) which is called "Pricing coverage".
The most important thing to know is that the pricing coverage is not related to counting trips at all.
The only purpose of pricing coverage is a reference to calculate the pricing. Pricing coverage in O/D Analysis is a buffer of roads that we take into consideration depending on the location of your analysis.
For the first 10 km of radius, this value is based on functional road classes from 0 to 5 (major roads).
For Selected Link reports with a radius bigger than 10 km from the link, pricing coverage value is calculated based on road classes from 0 to 5 (for the first 10 km) and then additionally based on road classes from 0 to 2 (for the area above 10 km).
Example for selected radius of 25 km: We sum up two values of pricing coverage:
- For the first 10 km based on FRCs 0-5
- The remaining 15 km based on FRCs 0-2 only.
While calculating the pricing coverage, we expand the area from the selected link in each direction, so it's just an informative display based on the link you specified, about the price of your analysis, not related to the data of traveling cars.

The maximum radius for the polygon geometry in the Selected Link report is 10 km. As a result, the Pricing Coverage value is calculated based on this limit.
Summary Step
When all the three steps are completed, the fourth and the last step is the "Summary". This is the final screen before ordering the report. It's a helpful overview of all the analysis specifics that can still be adjusted in case it's necessary.
The analysis will start calculating after pressing the "Order report" button.
Calculations time needed to complete the analysis varies due to different factors such as the date ranges used (how long the analyzed period is), how many time sets were selected and how big the selected link route is.
Usually, it should not take longer than 30-60 minutes to calculate a report but please keep in mind, that in some cases it can take up to a few hours. If your analysis is calculating for more than 24 hours, feel free to reach out to us via e-mail to MoveSupport@tomtom.com and we will be able to see if everything is working properly.
